Find the setup before the crowd
Scan up to 500 tickers for statistical anomalies — short interest, days-to-cover, volume ratio — and hunt the conditions behind your best trades.
Unique Feature · All Plans (universe scales)▮ A research pass, not a feed
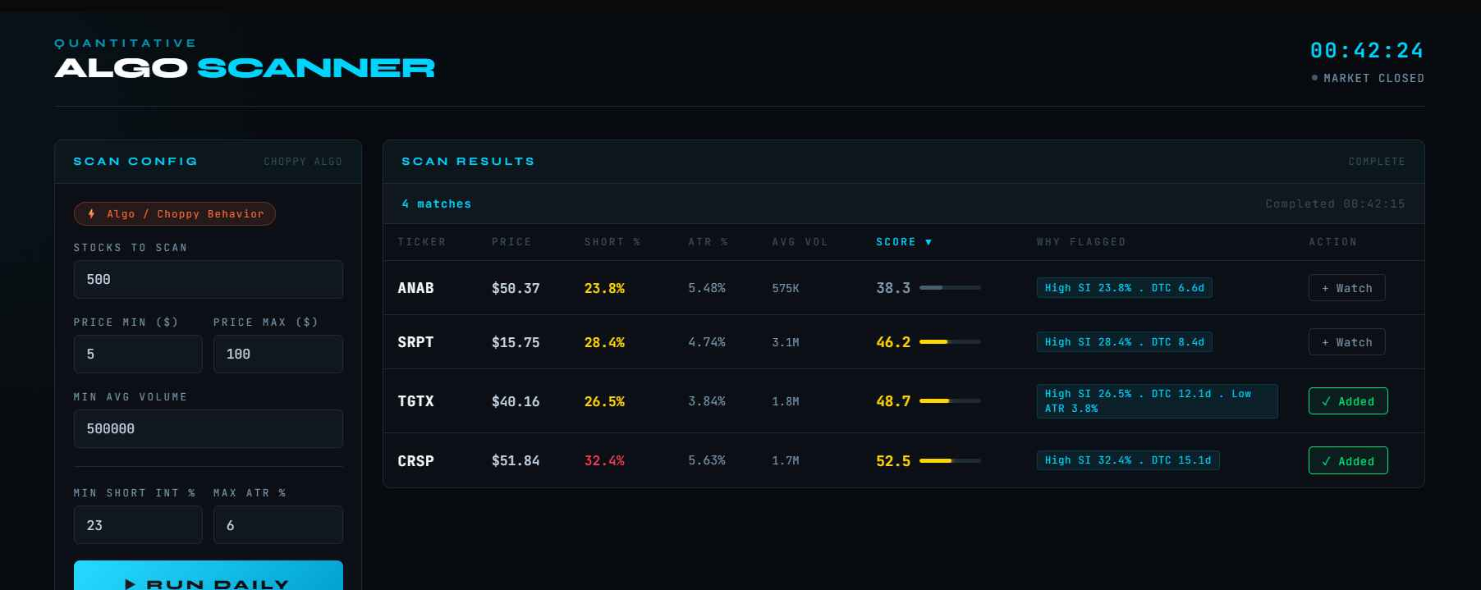
The Pattern Scanner sweeps a ticker universe for statistical anomalies — high short interest, elevated days-to-cover, low ATR, and unusual volume ratio — the structural conditions behind many of the market's sharpest moves. Use it to find setups that rhyme with your best historical trades, before the crowd does.
▮ Scaled by plan
The scanner runs the same math on every tier; only the size of the universe scales: 50 tickers on Basic, 200 on Advanced, 500 on Premium. Limits on convenience, never on the discipline habit.
▮ Honest by design
What it does
- Scans 50 / 200 / 500 tickers by tier
- Flags short interest, days-to-cover, volume-ratio, and ATR anomalies
- Pairs naturally with your own setup analytics — hunt what has paid YOU
What it deliberately doesn't
- No real-time streaming or intraday alerts — it's a research pass, not a feed
- No buy signals — a statistical anomaly is a place to look, not a reason to click
Why: the scanner finds conditions, you find trades. The legal terms and the in-app disclaimer say exactly the same thing.
See your edge for yourself.
Every plan includes the full journal, unlimited accounts, and 10 AI grades a day — no API key needed.
View Plans Download TradeCraft