Know your edge — prove it
Equity curve, win rates, drawdown, streaks, heat-map calendar, and breakdowns by ticker, setup, weekday, and hold time — all computed on realized results only.
Core Feature · Every Plan▮ Every number, auditable
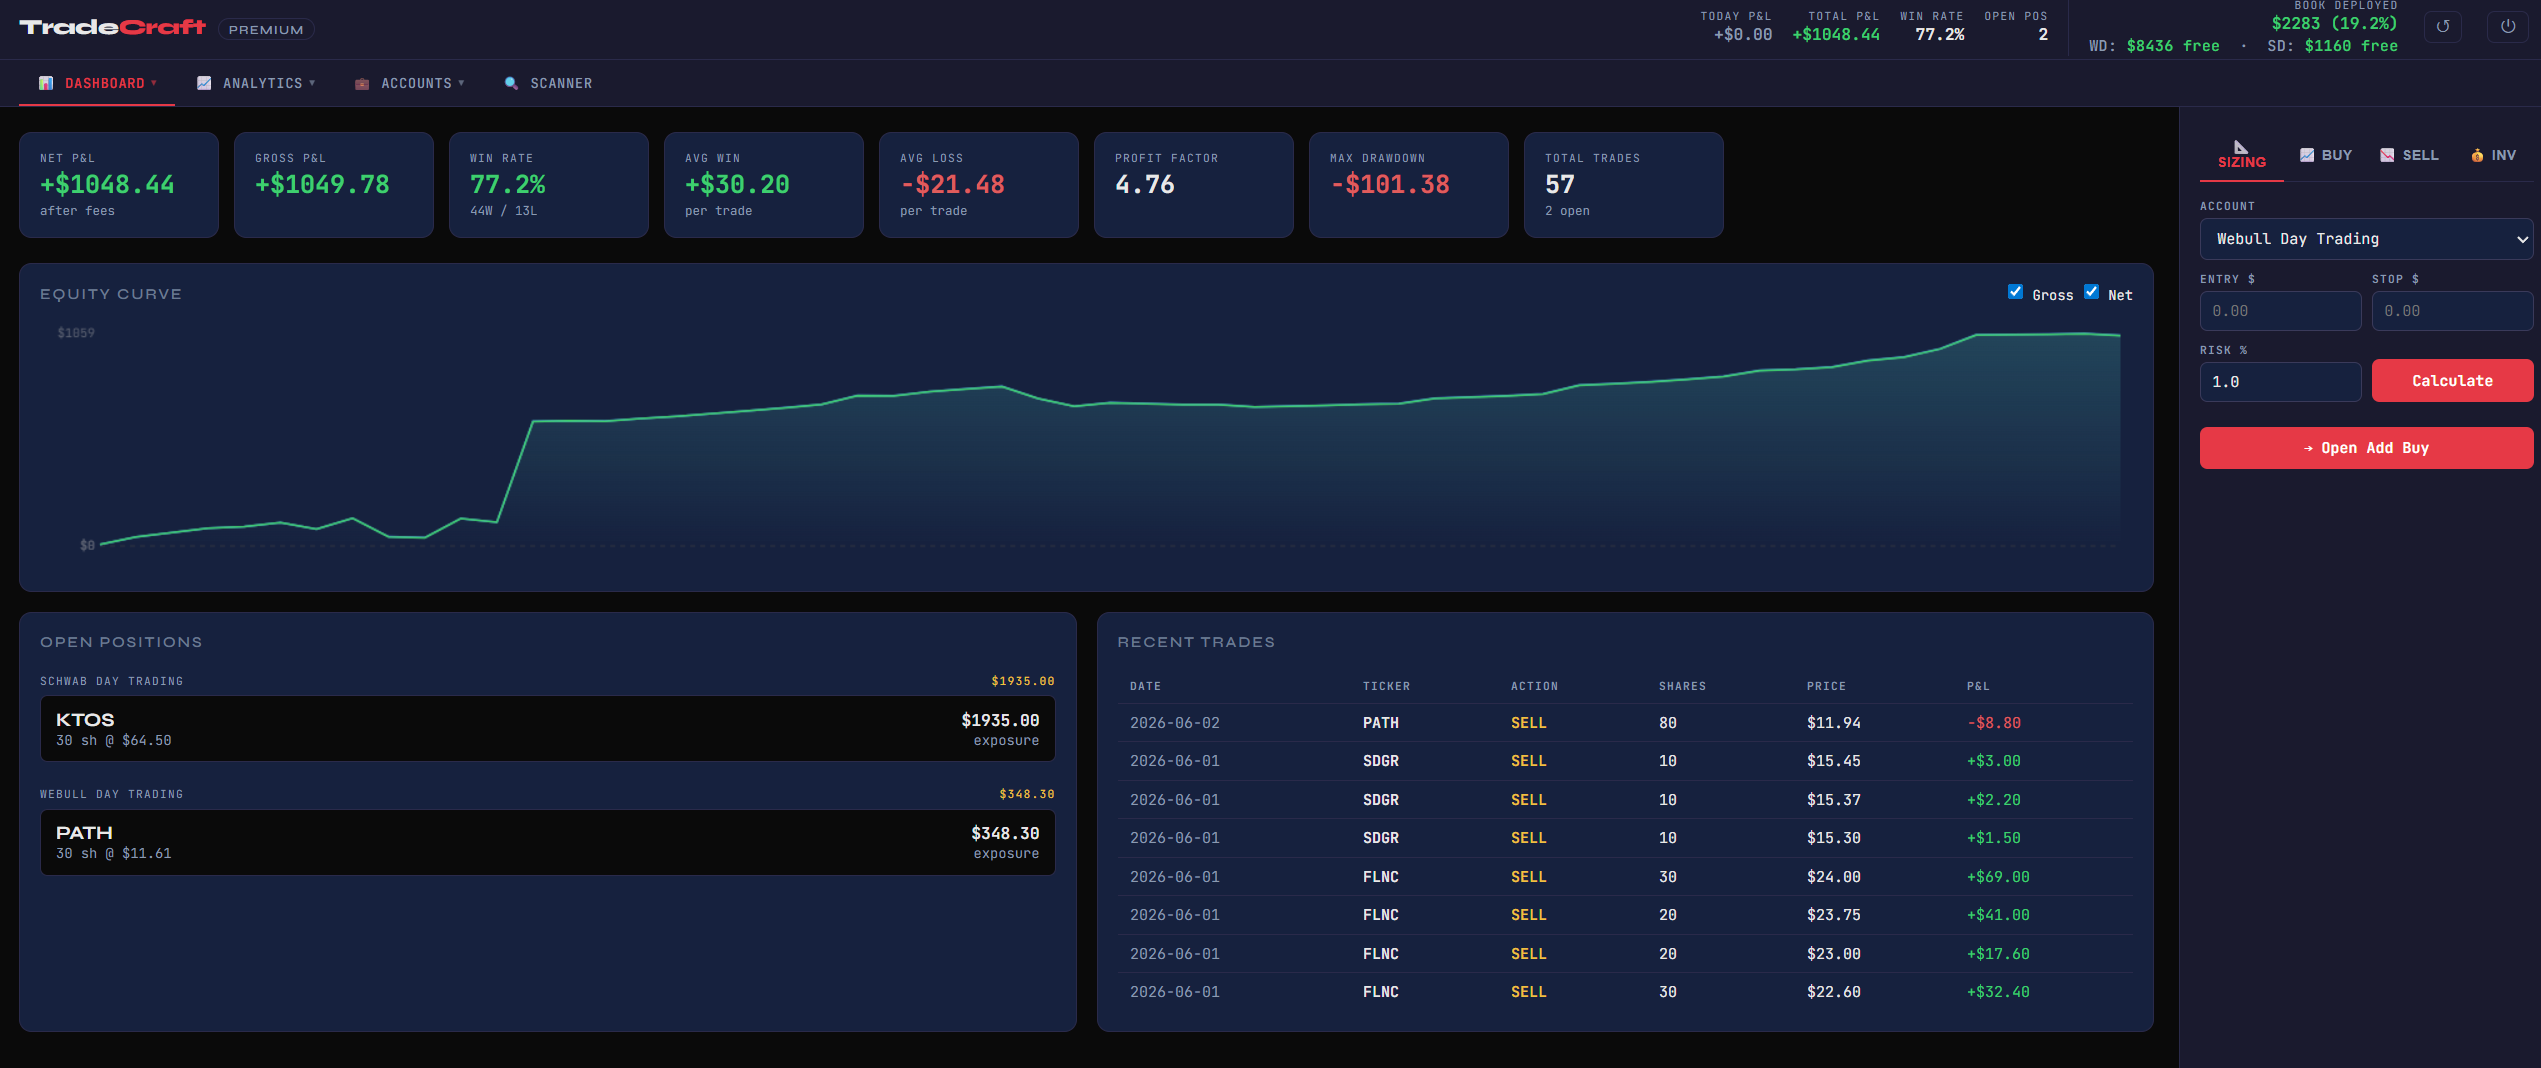
All statistics are computed on closed trades — sells with realized P&L. Win rate, streaks, max drawdown, profit factor, and the equity curve from cumulative net P&L: every figure on the dashboard traces back to rows in your trade log. Open positions are never counted in performance stats, and unrealized P&L is never marked into the curve.
▮ Find your edge — and your leaks
By ticker & by setup
P&L and win rate broken down by symbol and by setup type — see which plays actually pay you and which only feel good.
By weekday
Win rate and average P&L per day of the week — the Monday problem shows up here first.
Hold duration buckets
From scalps under 5 minutes to multi-day holds: where your profits actually live on the clock.
Quality vs results
Your own 1–10 setup scores charted against outcomes — calibrating self-assessment is half the job.
Win/loss anatomy
Average winner vs average loser, best and worst trades, win/loss ratio, and your current streak.
Equity curve, two ways
Gross and net lines toggle independently — watch what fees are really costing you.
▮ The calendar tells on you
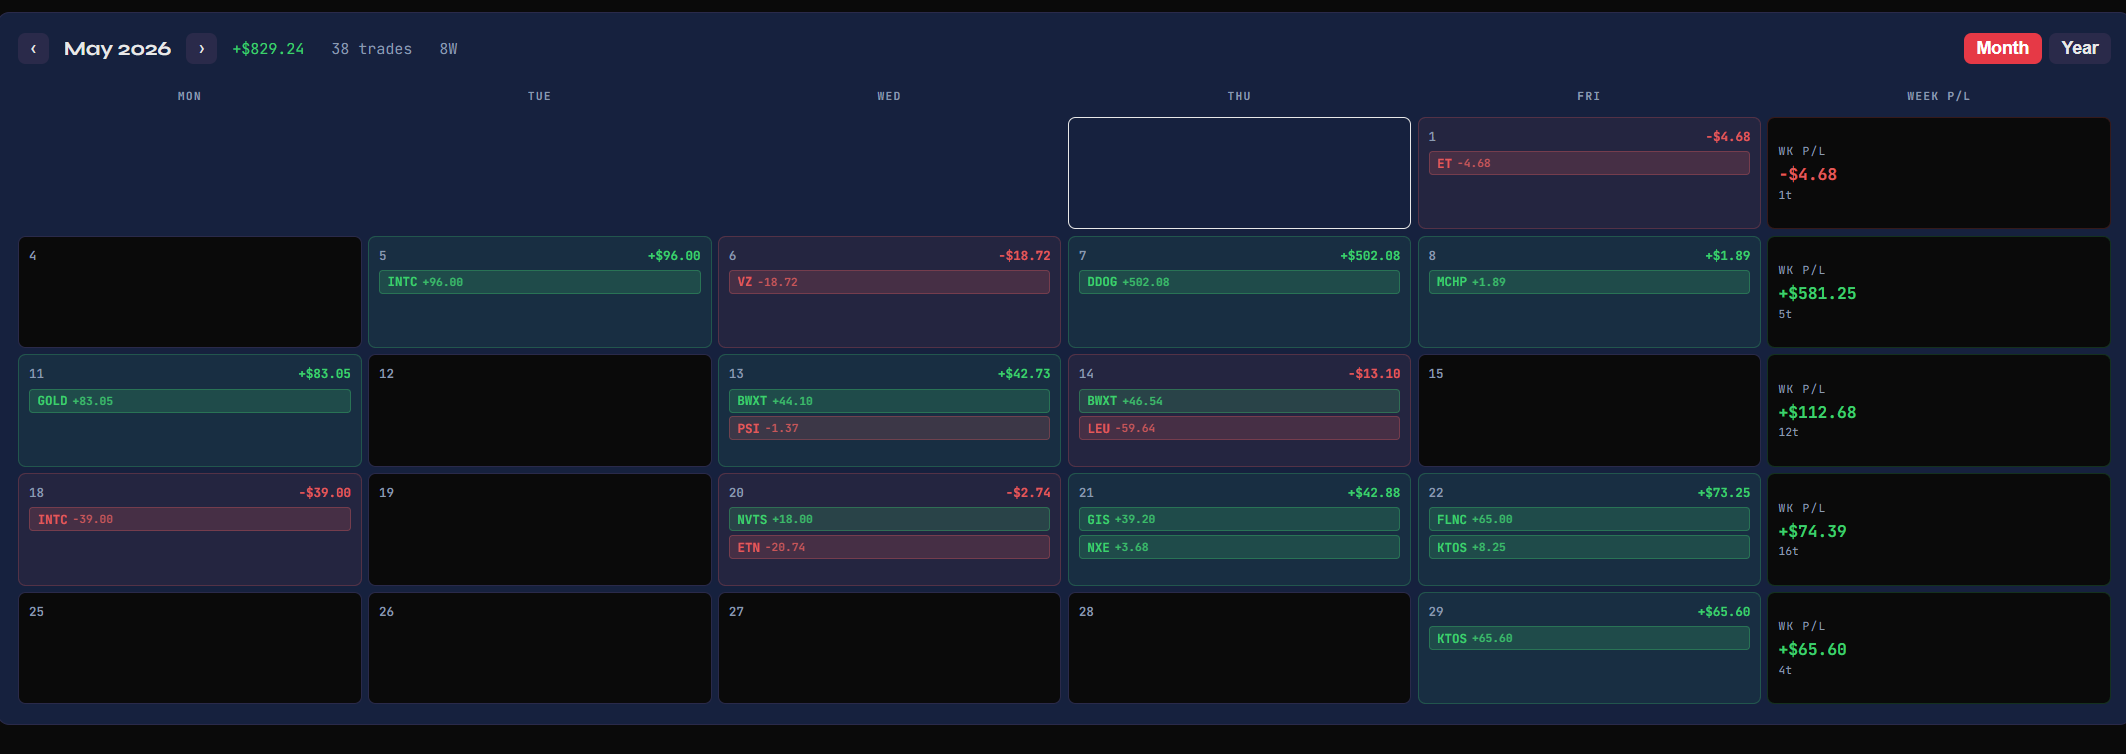
A monthly P&L heat map — every trading day colored by realized result, with day-level detail one click away. Streaks, revenge-trading days, and the sessions you should have skipped are all visible at a glance.
▮ Honest by design
What it does
- Win rate, streaks, drawdown, profit factor — computed on closed trades only
- Equity curve from cumulative net P&L (gross toggle included)
- Calendar heat map by day with per-day drill-down
- Breakdowns by ticker, setup, weekday, hold duration, and quality score
What it deliberately doesn't
- No open positions in performance stats
- No mark-to-market unrealized P&L in the equity curve
- No vanity metrics that can't be traced to trade-log rows
Why: realized-only keeps every number auditable. If the dashboard says it, the trade log can prove it.
▮ On every plan
See your edge for yourself.
Every plan includes the full journal, unlimited accounts, and 10 AI grades a day — no API key needed.
View Plans Download TradeCraft